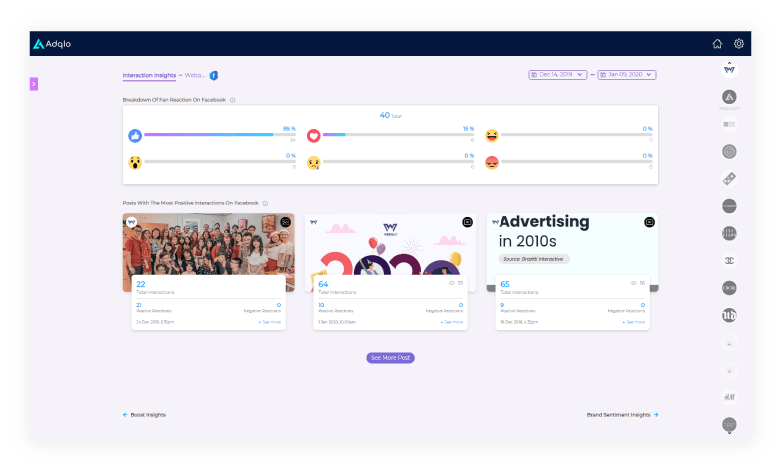
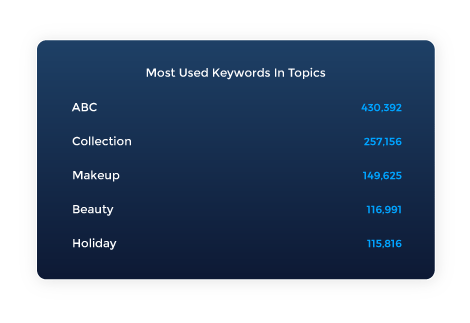
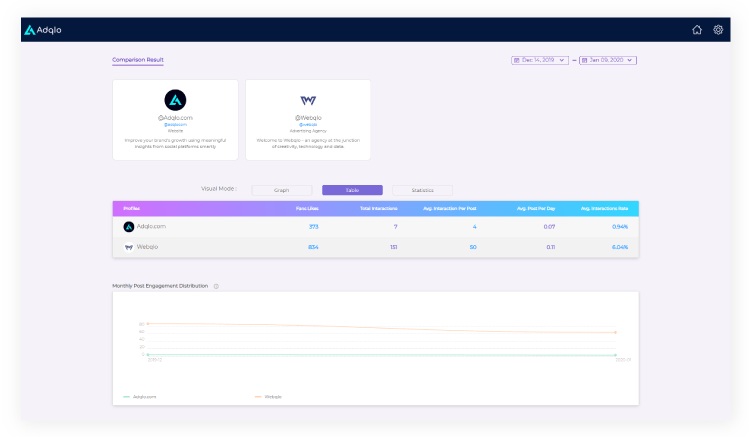
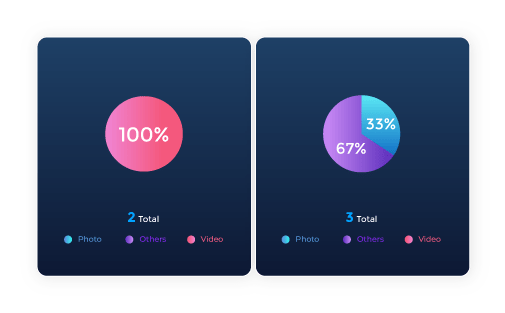
About Data Visualisation

Imagine being presented an excel sheet filled with data, and you’re asked to analyse it. Instead of cracking your head at where to begin, Adqlo’s data visualisation makes it easy to understand using comprehensive graphs, maps, and charts.

Data Made Easy

Uncover deep insights about your business’s performance through comprehensive visuals and identify any emerging opportunities and risks.

Reduce Repetition

Save your team from repetitive, time-consuming tasks in compiling, extracting, and analysing data. With just a few clicks, all of your data will be immediately illustrated into visuals.

Quick Decisions

Pinpoint any new data insights, outliers, patterns, and even trends that you can quickly apply to improve your business’s performance.

ADQLO
Technology, experience, and solution all in one

We bring marketing data and solutions to you in a single space, so it is easy and accessible for you to self-service your business analytics. Let’s talk about what Adqlo can do for your business.